
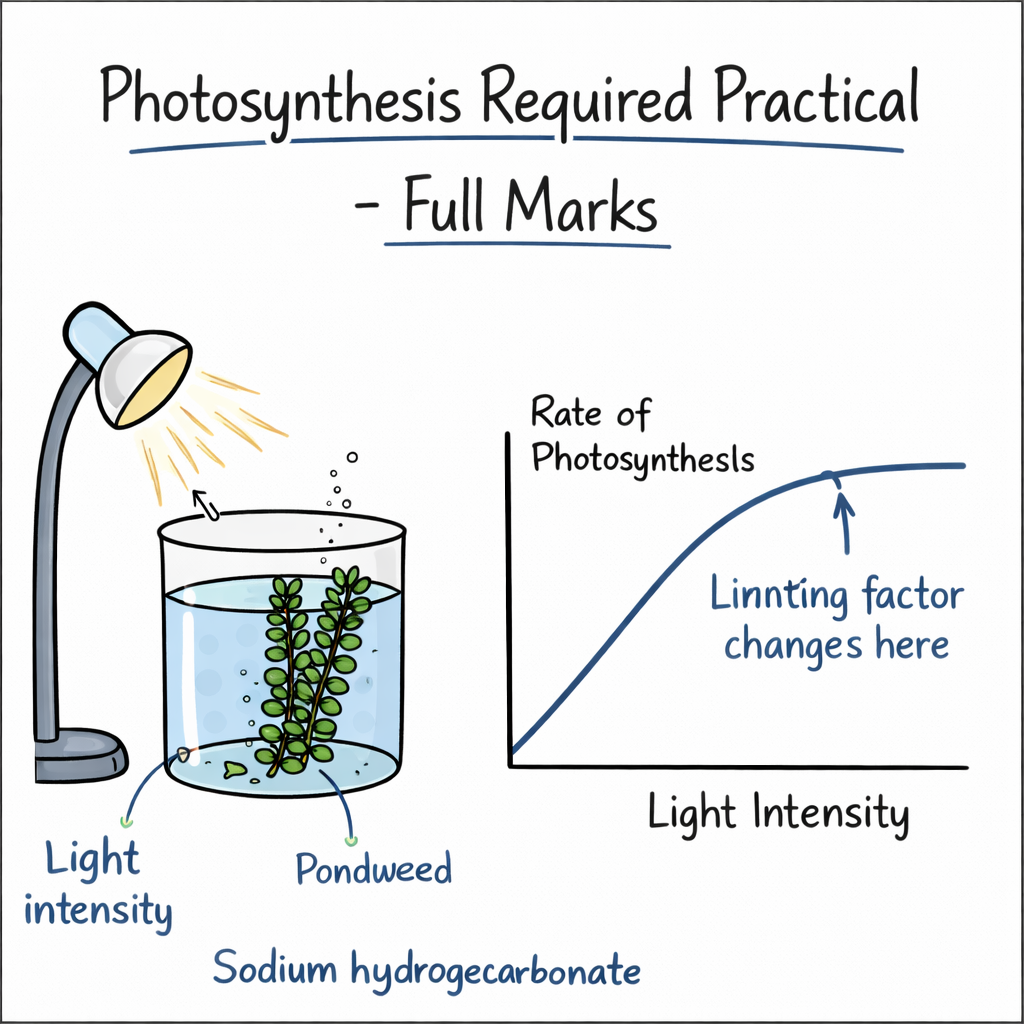
Photosynthesis Required Practical GCSE
The photosynthesis required practical investigates how light intensity affects the rate of photosynthesis. Students must understand how the investigation is carried out, which variables should be controlled, how oxygen production is measured and why the rate eventually stops increasing.
This practical can be tested through questions about experimental methods, variables, graphs, limiting factors, accuracy and reliability. Students therefore need to understand the investigation rather than simply memorising a list of instructions.
What Does the Photosynthesis Required Practical Investigate?
The investigation measures how changing light intensity affects the rate of photosynthesis in pondweed.
During photosynthesis, plants use light energy to convert carbon dioxide and water into glucose and oxygen:
Carbon dioxide + water → glucose + oxygen
Oxygen production can therefore be used as an indication of the rate of photosynthesis. The faster oxygen is produced, the faster photosynthesis is taking place.
In the investigation, the distance between a lamp and a piece of pondweed is changed. Moving the lamp closer generally increases the light intensity reaching the pondweed.
Students should understand that distance is the variable being directly changed. Light intensity is the factor affected by this change.
For a wider overview of how practical work is assessed, revise GCSE Science Required Practicals Explained.
Photosynthesis Required Practical Method
-
Place a piece of pondweed in water containing sodium hydrogencarbonate solution.
-
Position a lamp at a measured distance from the pondweed.
-
Allow the pondweed time to adjust.
-
Measure the oxygen produced over a fixed time.
-
Move the lamp to a different distance.
-
Repeat the measurement at each distance.
-
Repeat the investigation and calculate a mean.
Measurement note: Counting bubbles is simple but not completely accurate because bubbles may have different volumes. Collecting and measuring the volume of oxygen gives a more valid measurement of the rate.
Sodium hydrogencarbonate is added to provide carbon dioxide. Without enough carbon dioxide, carbon dioxide concentration could limit the rate of photosynthesis and interfere with the investigation of light intensity.
The pondweed should also be left for the same adjustment period after the lamp is moved. This allows the plant to respond to the new light intensity before oxygen production is measured.
Variables in the Photosynthesis Required Practical
| Variable | What it is |
|---|---|
| Independent variable | Distance between the lamp and pondweed |
| Dependent variable | Oxygen produced per unit time |
| Control variable | Temperature |
| Control variable | Carbon dioxide concentration |
| Control variable | Length or species of pondweed |
| Control variable | Measurement time |
The independent variable is the factor deliberately changed. In this investigation, this is the distance between the lamp and the pondweed.
The dependent variable is the factor measured. This is the amount of oxygen produced in a fixed period, such as the number of bubbles per minute or the volume of oxygen collected per minute.
Control variables must be kept constant so that changes in oxygen production can be linked to the change in light intensity rather than another factor.
Writing “keep everything else the same” is not precise enough in an exam answer. Students should identify specific control variables.
Why Temperature Must Be Controlled
A lamp can transfer thermal energy to the water as well as providing light. Moving the lamp closer may therefore increase the temperature of the water.
Temperature affects the rate of photosynthesis because photosynthesis is controlled by enzymes. If the temperature changes during the investigation, it becomes difficult to determine whether a change in oxygen production was caused by light intensity or temperature.
Temperature can be controlled by:
-
using a water bath
-
placing a transparent heat shield between the lamp and pondweed
-
monitoring the water with a thermometer
-
allowing the apparatus to return to the required temperature before each measurement
A water bath is generally more effective than simply checking the temperature because it helps maintain a constant temperature throughout the investigation.
Measuring the Rate of Photosynthesis
There are two common ways to measure oxygen production.
Counting oxygen bubbles
The student counts the number of bubbles released by the pondweed during a fixed period.
This method is:
-
simple
-
quick
-
easy to repeat
However, it has an important limitation: oxygen bubbles may not all have the same volume. Two measurements with the same number of bubbles may therefore represent different volumes of oxygen.
Bubbles may also be released too quickly to count accurately.
Measuring oxygen volume
A more valid method is to collect the oxygen and measure its volume using equipment such as a gas syringe or graduated capillary tube.
This provides a quantitative measurement of oxygen production rather than assuming that every bubble contains the same amount of gas.
In an evaluation question, students should not simply state that measuring gas volume is “more accurate”. They should explain why:
Measuring oxygen volume is more valid because bubbles can have different volumes, so counting bubbles may not accurately represent the total oxygen produced.
How Light Intensity Changes with Distance
Moving the lamp closer increases the light intensity reaching the pondweed. Moving it further away decreases the light intensity.
For a point source of light, light intensity can be estimated using:
Light intensity ∝ 1 ÷ distance²
This is known as the inverse-square relationship.
For example, if the distance from the lamp is doubled, the light intensity becomes approximately one-quarter of its previous value.
Students may be asked to calculate relative light intensity using:
Relative light intensity = 1 ÷ distance²
The distance must be measured consistently from the same part of the lamp to the same part of the pondweed.
Expected Results
At greater distances, the pondweed receives a lower light intensity. Light is more likely to be the limiting factor, so the rate of photosynthesis is relatively low.
As the lamp is moved closer:
-
light intensity increases
-
more light energy reaches the pondweed
-
the rate of photosynthesis increases
-
oxygen is produced more quickly
A graph of oxygen production against light intensity would normally rise at first and then begin to level off.
If distance is plotted directly instead, the general trend is reversed: increasing the distance normally decreases the rate of oxygen production.
Why the Rate Eventually Levels Off
Moving the lamp closer increases light intensity, so light becomes less likely to limit photosynthesis. Eventually, another factor such as carbon dioxide concentration or temperature becomes limiting, so the rate no longer increases substantially.
At the plateau, increasing light intensity further has little effect because light is no longer the main limiting factor.
Students should not write that the plant has received the “maximum amount of light”. The important explanation is that another factor has become limiting.
For example:
-
there may not be enough carbon dioxide available
-
the temperature may not be at the optimum for the enzymes involved
-
another condition required for photosynthesis may prevent the rate from increasing further
A strong graph answer should describe both the trend and its scientific explanation:
The rate of photosynthesis increases as light intensity increases because light is initially the limiting factor. The graph then levels off because another factor, such as carbon dioxide concentration or temperature, becomes limiting.
Making the Results More Reliable
Reliability concerns whether repeated measurements give similar results.
Students can improve reliability by:
-
repeating each measurement
-
identifying anomalous results
-
calculating a mean
-
using the same method at every distance
-
collecting results over a sufficiently long measurement period
Repeating only the entire experiment once is weaker than taking several measurements at every distance.
When calculating the mean, an anomalous result should only be excluded when there is a valid reason for treating it as anomalous. Students should not automatically remove a result simply because it is different.
Common Photosynthesis Practical Mistakes
Students commonly lose marks by:
-
failing to mention sodium hydrogencarbonate
-
confusing the independent and dependent variables
-
writing “amount of light” instead of light intensity
-
failing to control temperature
-
changing the measurement time between results
-
counting bubbles without recognising the limitation
-
forgetting to repeat measurements and calculate a mean
-
failing to explain why the graph reaches a plateau
-
saying that photosynthesis stops when the graph levels off
When the graph levels off, photosynthesis has not necessarily stopped. Its rate has stopped increasing substantially.
Review GCSE Science Required Practical Mistakes to see how vague methods and weak evaluations lose marks.
GCSE Exam Question
Question: Explain why moving the lamp closer initially increases the rate of photosynthesis.
Model answer
Moving the lamp closer increases the light intensity reaching the pondweed. More light energy is available for photosynthesis, so oxygen is produced at a faster rate.
Common mistake
Do not write only that the plant receives “more light.” Explain that light intensity increases and the rate of photosynthesis increases.
Extended Exam Question
Question: A student investigates the effect of light intensity on the rate of photosynthesis using pondweed. Describe a suitable method and explain how the student could obtain valid and reliable results.
Model answer
Place a piece of pondweed in water containing sodium hydrogencarbonate solution. Position a lamp at a measured distance from the pondweed and allow the pondweed time to adjust. Measure the volume of oxygen produced during a fixed period. Repeat the measurement at several different distances from the lamp.
Keep the temperature, carbon dioxide concentration, species and length of pondweed, and measurement time constant. Use a water bath to control temperature because the lamp may heat the water. Repeat the measurement at each distance and calculate a mean to improve reliability. Measuring oxygen volume is more valid than counting bubbles because bubbles can have different volumes.
For more help structuring longer practical answers, use How to Answer 6-Mark GCSE Science Questions.
How to Revise the Photosynthesis Required Practical
Students should be able to complete five tasks without using their notes:
-
Write the method in the correct order.
-
Identify the independent, dependent and control variables.
-
Explain why temperature must be controlled.
-
Explain why oxygen volume is preferable to bubble counting.
-
Explain why the rate eventually levels off.
Watching an explanation is useful, but students should then practise retrieving the method and answering exam questions independently.
Students can use GCSE Biology Revision to review photosynthesis and other Biology topics before applying their knowledge to exam questions.
Revise the Photosynthesis Practical with KayScience
Students can use KayScience to revise the photosynthesis practical, test their knowledge and practise applying the method to GCSE exam questions.
Start a free trial to access structured GCSE Biology videos, quizzes and exam-question practice.
Start revising today
800+ video lessons, quizzes and exam questions for GCSE Science.
Start Your Free Trial